Dramatic Rise and Fall of Heart Disease in the US
- CAD (coronary artery disease) accounted for 10% of all deaths at the turn of the 20th century and increased to 56% of all deaths at the height of CAD epidemic in 1968.1 Since then, the death rate has decreased by 70% and now CAD accounts for only 17% of all deaths (2007).
- The age-adjusted death rates from CAD decreased by 43% between 1980 and 2000. Of this decline, 47% was attributed to improvements in the treatment of people with heart disease (secondary prevention) and 44% due to reduction of risk factors in apparently healthy people (primary prevention).2 Among the latter the major contributors were lower cholesterol (24%), lower blood pressure (20%), and lower rates of smoking (12%). Coronary angioplasty/stent and bypass contribution was less than 5%.2
- A more detailed analysis showed that reduction in three major risk factors ─ cholesterol, blood pressure, and smoking─ in primary prevention accounted for 79% of the mortality decrease. The contribution of these three risk factors is much smaller in secondary prevention─ only 21%.3 This data underscore the need for treating modifiable risk factors before a cardiac catastrophe (as is currently practiced in many parts of the world).
- The decline in stroke in the US and Japan was even greater than CAD (80%); Control of hypertension and other risk factors are credited for this decline.
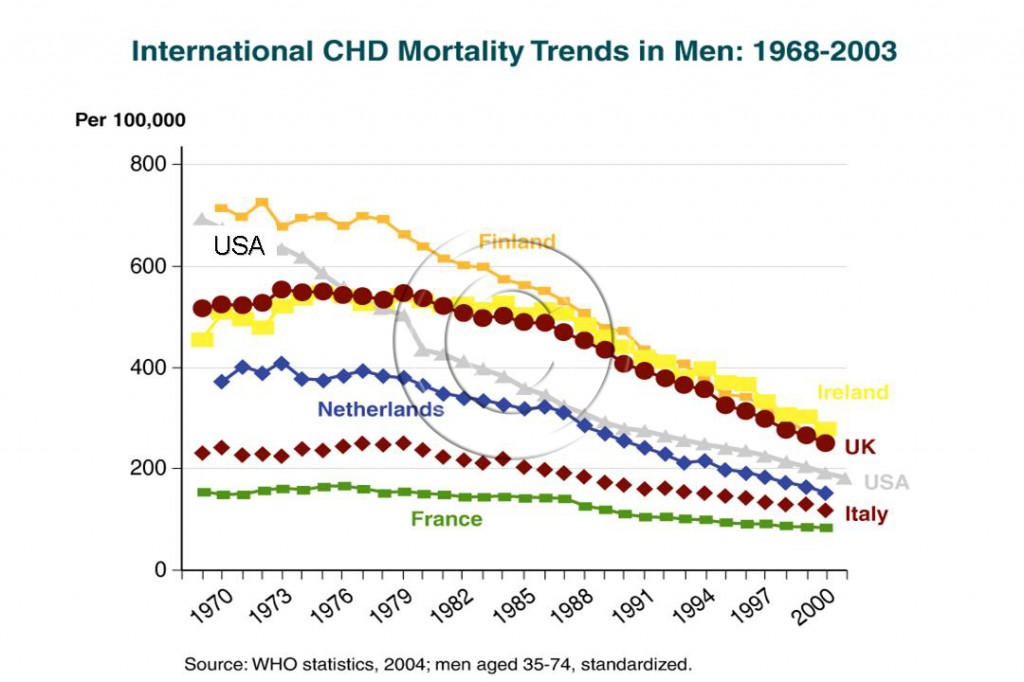
- Not only the US but several countries, such as Canada, UK, Australia, Finland, and Ireland have achieved a death reduction of 50% to 80% (Figure 007).2 More importantly, 50% to 75 % of CAD mortality fall was attributed to reductions in the 3 major risk factors- cholesterol, blood pressure, and smoking.2, 4-7
AHA 2012 Statistics
- Of a total population of 310 million Americans, 85 million (28%) are under 20 years of age and 39 million (13%) are age 65 and over. The national median age is 37 years and life expectancy is 78 years. 8
- CVD- The 2008 overall rate of death attributable to cardiovascular disease (CVD) was 245 per 100 000. From 1998 to 2008, the rate of death attributable to CVD declined 31%. Mortality data show that CVD accounted for 33% (811,940) of all 2.5 million deaths in 2008, or 1 of every 3 deaths in the United States. 8
- On the basis of 2008 mortality rate data, more than 2200 Americans die of CVD each day, an average of 1 death every 39 seconds. About 18% Americans killed by CVD in 2008 were 65 years of age and 33% of deaths due to CVD occurred before the age of 75 years, which is well before the average life expectancy of 78 years.8 225 million people are in the age group (more than 20 years of age) for CVD in the US compared to 780 million in India (3.5 times).
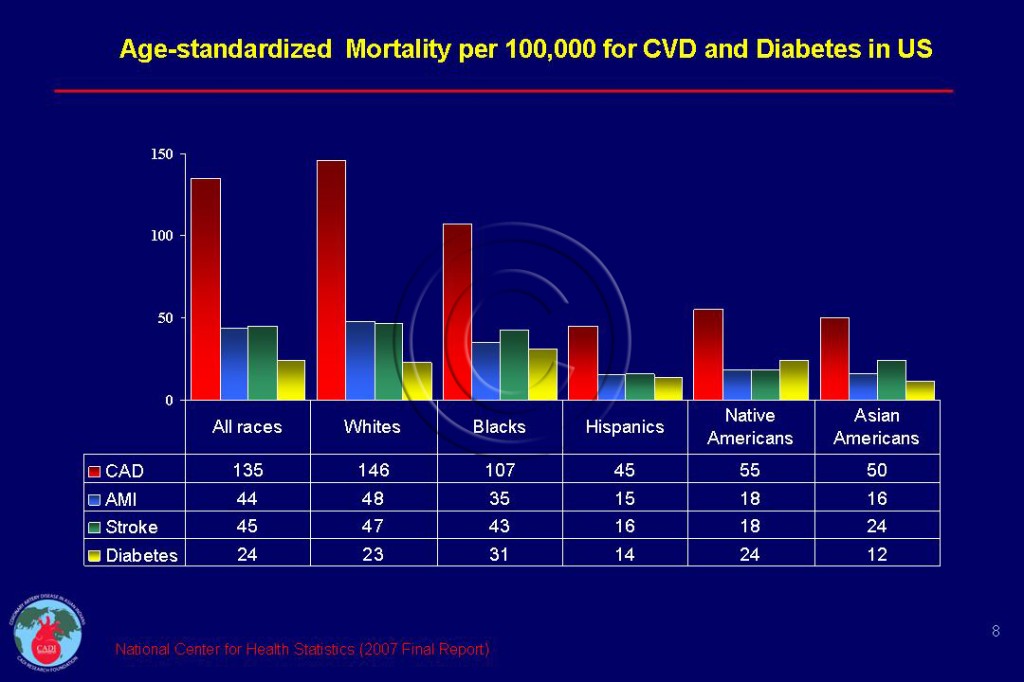
- Of all the CVD deaths, CAD accounts for 50%, stroke 17%, heart failure 7% and high blood pressure 7%.8 The difference in mortality from heart disease, heart attack, stroke, and diabetes among Americans of different ethnic origins is given in Figure 008. Despite high rates of diabetes, Hispanics have the lowest CAD mortality followed by Asians and Native Americans.
- CAD- Due to better survival following heart attack and heart failure, the overall prevalence of CAD has increased over the years from 2.5% to 7% (16.3 million). However rates are higher in men (8%), especially white men (9%). The prevalence is lower among women in general (6%) but higher among black women (8%). The prevalence is 7% among American Indian (Native Americans) men and women. The prevalence of CAD is less than the national average among Asian men and women (4%).The prevalence increases dramatically with age from <1% at ages 20-39 to 6% at ages 40-59. The prevalence is 23% for men and 14% for women 60-79 years of age.8
- Coronary artery disease caused 405,309, 1 of every 6 deaths in the United States. Each year, an estimated 785,000 Americans will have a new coronary attack, and 470,000 will have a recurrent attack. It is estimated that an additional 195,000 silent first myocardial infarctions occur each year. Approximately every 25 seconds, an American will have a coronary event, and approximately every minute, someone will die of one. 70% of CAD deaths occurred outside the hospital. (However having a defibrillator at home does not help much according to a recent study unlike its value in public places). 8
- Most heart attacks in the US occur in the elderly. Only 41% of the heart attacks in men and 21 % of heart attacks in women occur in those <65 years of age. Heart attacks before age 45 accounts for only 5% of all heart attacks in men and 2 % of heart attacks in women in the US compared to more than 30% among Indians. (see Tsunami of Heart disease in India)8
- In 2008, 1 in 9 death certificates (281,437 deaths) in the United States mentioned heart failure.8
- Stroke- Each year, 795 000 people experience a new or recurrent stroke. Approximately 610 000 of these are first attacks, and 185 000 are recurrent attacks. Mortality data from 2008 indicate that stroke accounted for 1 of every 18 deaths in the United States. On average, every 40 seconds, someone in the United States has a stroke. From 1998 to 2008, the stroke death rate fell 34.8%, and the actual number of stroke deaths declined 19.4%.8
- Prevalence of Risk Factors- The prevalence of smoking, high cholesterol, and high blood pressure decreased significantly in the US, whereas obesity, diabetes, prediabetes, and metabolic syndrome have increased, commensurate with the increase in caloric intake which was 10% in men and 22% in women. 8
- Currently the prevalence of high cholesterol (>240 mg/dl) is 16%, high blood pressure 34%, and diabetes 8% excluding a 3% undiagnosed diabetes and 37% with prediabetes. 67% are overweight and 33% are obese. 18% of women and 23% of men are smokers.8
- Economic Cost- The total direct and indirect cost of CVD is $298 billion. The estimated direct and indirect cost of heart disease for 2010 is $190 billion. 10% of patients account for 64% of the US health care costs. Much of this cost derives from high rates of unnecessary hospitalizations, procedures, and potentially avoidable complications.8
- Although triumphant procedures in cardiology such as left ventricular assist devices (LVAD) are inserted in people who are poor candidates for heart transplant or those who are waiting for transplant, most of the decline in the heart disease in the US is attributed to the control of just three risk factors─ cholesterol, blood pressure, and tobacco use with medications and lifestyle modifications.8
Decline in CAD Deaths in the US ─ Lessons for India
- In 1997, the American Heart Association (AHA) set an aggressive goal to reduce death from heart disease and stroke by 25% by 2010. The AHA not only have achieved but exceeded this goal! In dropping the death rate by 30%, 160,000 more people were alive in 2008. The AHA goal is to further reduce the heart disease and stroke death rates by 20% from 2010 to 2020.11
- This together with 70% decline of CAD mortality already achieved over the last 35 years clearly demonstrate a similar dramatic reduction in CAD can be achieved in India by simply applying the knowledge that already exist with regard to lifestyle choices and medications (see CAD Prevention and Control).
FAQ
Q.What is the forecast of the future of cardiovascular disease in the United States?
A. Assuming no change in policy, over the next 20 years, Americans with coronary heart disease will increase by 8 million (to 24 million), stroke by 4 million, and heart failure will increase 3 million.1 Direct CVD costs will triple to $818 billion by 2030. Conversely, if everyone received the 11 recommended prevention activities; heart attacks and strokes would decrease 63% and 31%, respectively, over the next 30 years. It is worth highlighting this is on the top of 70% reduction in CAD and 75% reduction in stroke achieved over the past 40 years. Researchers suggest placing a greater emphasis on engaging in CVD prevention earlier in life.12
Sources
1. American Heart Association Heart and Stroke Statistical Update2010.
2. Ford ES, Ajani UA, Croft JB, et al. Explaining the decrease in U.S. deaths from coronary disease, 1980-2000. N Engl J Med. Jun 7 2007;356(23):2388-2398.
3. Young F, Capewell S, Ford ES, Critchley JA. Coronary mortality declines in the U.S. between 1980 and 2000 quantifying the contributions from primary and secondary prevention. Am J Prev Med. Sep 2010;39(3):228-234.
4. Capewell S, O’Flaherty M. What explains declining coronary mortality? Lessons and warnings. Heart. Sep 2008;94(9):1105-1108.
5.Capewell S, Beaglehole R, Seddon M, McMurray J. Explanation for the decline in coronary heart disease mortality rates in Auckland, New Zealand, between 1982 and 1993. Circulation. 2000;102(13):1511-1516.
6. Capewell S, Morrison CE, McMurray JJ. Contribution of modern cardiovascular treatment and risk factor changes to the decline in coronary heart disease mortality in Scotland between 1975 and 1994. Heart. 1999;81(4):380-386.
7. Unal B, Critchley JA, Capewell S. Explaining the decline in coronary heart disease mortality in England and Wales between 1981 and 2000. Circulation. Mar 9 2004;109(9):1101-1107.
8. American Heart Association. Heart and Stroke Statistical Update2011.
9. Orszag PR, Emanuel EJ. Health care reform and cost control. N Engl J Med. Aug 12 2010;363(7):601-603.
10. de Brantes F, Rosenthal MB, Painter M. Building a bridge from fragmentation to accountability–the Prometheus Payment model. N Engl J Med. Sep 10 2009;361(11):1033-1036.
11. American Heart Association. Heart and Stroke Statistical Update2010.
12. Heidenreich P A, Trogdon JG, Khavjou OA, et al. Forecasting the future of cardiovascular disease in the United States: a policy statement from the American Heart Association. Circulation. Mar 1 2011;123(8):933-944.


